Themeisle Visualizer Charts and Graphs Pro
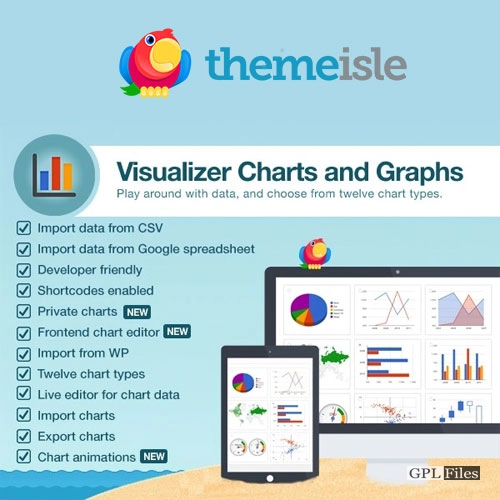
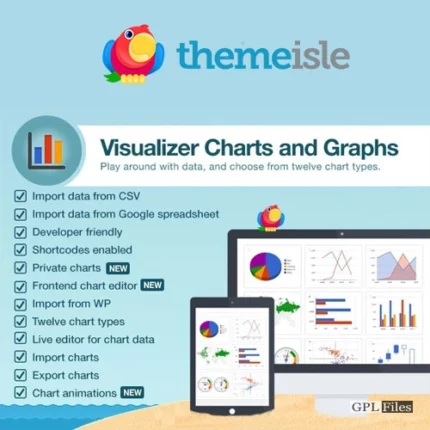
The effective plugin Visualizer makes it simple to design, maintain, and incorporate interactive charts into your WordPress posts and pages.
To render charts, the plugin leverages the Google Visualization API, which supports:
- portability between platforms for iOS and Android
- Browser compatibility Across
Download and Install
Make sure to adhere to the instructions below to download and instal the Visualizer plugin:
- Proceed to the Plugins section of the Dashboard in WordPress.
- To add a new visualizer, click the Add New button and then type ” Visualizer” into the Search Bar.
- When the plugin pops up, click the Install button, and once it’s installed, click the Activate button.
Managing the Charts
Within the Visualizer plugin, there are a variety of operations that can be performed on Charts and Graphs. These operations may be accessed directly from the Visualizer > Charts Library.
Available Data Sources of Charts
Because of its import functionality, the Visualizer plugin can save users a significant amount of time, which is one of the most valuable benefits that it offers.
Charts Library
To go to the Charts Library, go to the Dashboard, then to the Visualizer, and then to the Charts Library.
The Visualizer Library gives you access to 15 different chart kinds that are optimised to meet your data visualisation needs. These chart types are divided between the Free Version and the Pro Version and include the following:
- a well-known library called DataTables
- 12 charts from Google
- 6 charts generated by using Chart.js
Features
Screen Options and Filters
You have the option of selecting a fewer number of charts to appear on each page in order to avoid overcrowding the library:
- Screen Options can be accessed by clicking the cogwheel icon in the top right corner of the screen.
- After entering your selected number, make sure you click the Apply button.
In addition, the charts can be filtered according to kind, library utilised, and date of creation.
- Choose your preferred options.
- Click on Apply Filters.
Translate Visualizer’s data
After the user toggles between languages using the language changer, Visualizer Pro is able to render the translated version of your charts and present them to them.








Reviews
There are no reviews yet.